
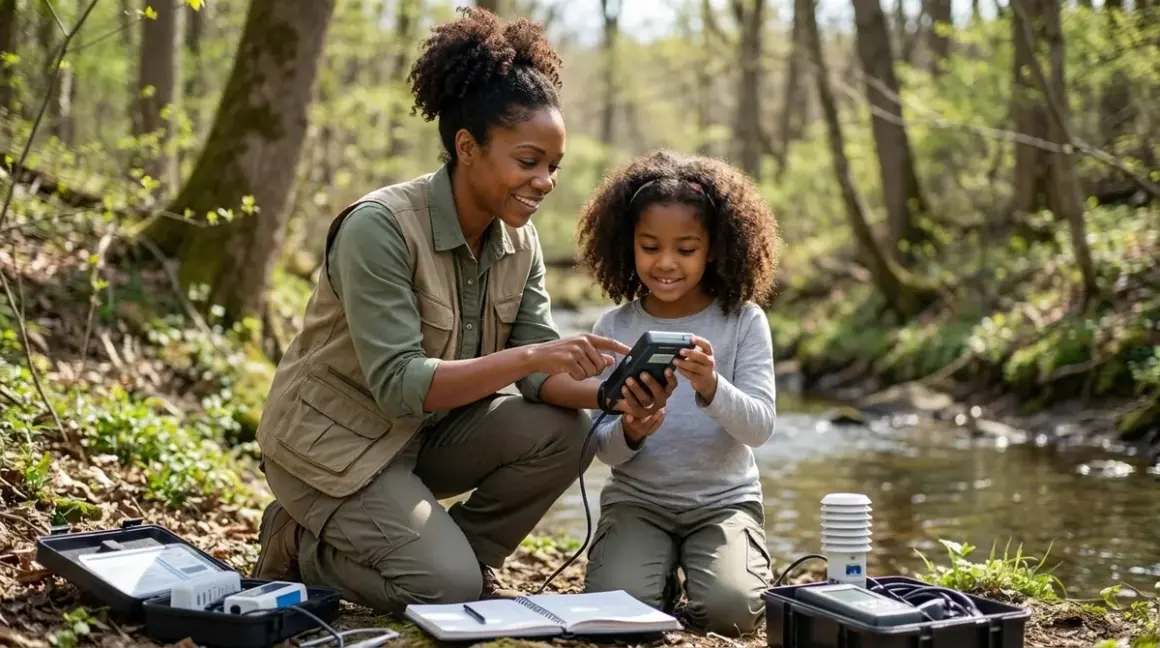

You're about to turn your child into a real data scientist—not the "learning to code" kind, but the kind who contributes actual observations to climate research databases. Learning how to collect environmental data kids can independently gather and interpret is one of the most concrete pathways from bedroom tinkering to professional-grade environmental monitoring. This guide walks you through the complete workflow: sensor selection, calibration, data collection protocols, visualization, and analysis using industry-standard platforms that working ecologists, air quality engineers, and climate scientists actually use.
Skill level: Ages 10–16, basic computer literacy required, no prior coding experience needed for entry-level platforms. Time estimate: Initial setup 2–3 hours; ongoing data collection runs 1–4 weeks depending on project scope.
You'll notice the learning curve here is steeper than snap-together robotics kits—and that's intentional. Environmental monitoring teaches scientific method under real-world constraints: sensor drift, calibration requirements, data noise, and the humbling reality that nature doesn't generate clean spreadsheets. These are the same frustrations professional researchers navigate daily, and working through them builds genuine scientific resilience.
What You'll Need
Hardware:
- Environmental sensor kit compatible with Arduino IDE, Python, or block-based platforms (recommendations below)
- Computer running Windows 10/11, macOS 12+, or Linux (Raspberry Pi 4+ works for many kits)
- MicroSD card (16GB minimum) for data logging if using offline collection
- Power supply appropriate to deployment environment (USB power bank, solar panel + battery, or AC adapter)
- Weatherproof enclosure if deploying outdoors (IP65-rated minimum)
- Calibration standards specific to sensors used (pH buffer solutions, gas standards, etc.)
Software:
- Arduino IDE 2.x (free, cross-platform) or Python 3.10+ with pandas/matplotlib libraries
- Data visualization platform: Google Sheets (beginner), Grafana (intermediate), or Jupyter Notebooks (advanced)
- Optional: Adafruit IO or ThingSpeak for cloud logging and real-time graphing
Skills prerequisites:
- Basic file management and USB driver installation
- Ability to follow written protocols precisely (critical for data validity)
- Patience with troubleshooting—sensors fail, connections loosen, and calibration drifts
Safety note: Check your Home STEM Lab Safety Checklist: Power, Ventilation, and Storage Requirements before deploying mains-powered sensors or working with chemical calibration standards.
Step 1: Choose Your Sensors Based on Research Question
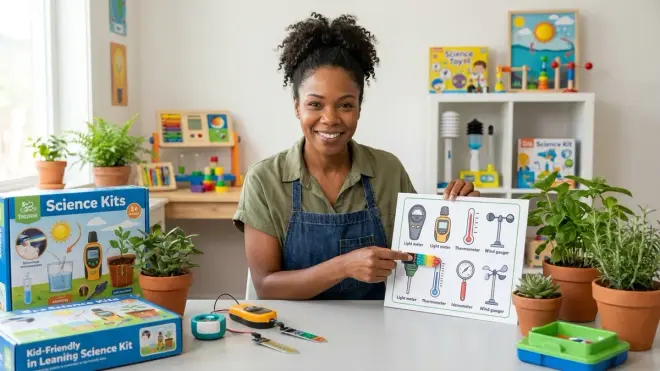
Start with the question, not the kit. "I want to monitor stuff" isn't a research question—it's a shopping impulse. What environmental variable matters in your community? Is your school near a highway where particulate matter might spike during rush hour? Does your local creek show algae blooms every summer? Is there a factory upwind whose emissions you suspect correlate with air quality complaints?
Your research question determines sensor selection. For air quality monitoring, the Adafruit BME680 Environmental Sensor measures temperature, humidity, barometric pressure, and VOC (volatile organic compound) levels—the last one's crucial because it detects indoor pollutants like cleaning chemicals and off-gassing from new furniture. For water quality, you'll need separate modules: pH, turbidity (cloudiness), dissolved oxygen, and temperature as a baseline.
Lab Specs to verify before purchasing:
- Measurement range and resolution: A pH sensor reading 0–14 in 0.1 increments is adequate for most environmental work; 0.01 resolution is overkill and costs more.
- Calibration requirements: Most electrochemical sensors (pH, dissolved oxygen) need recalibration every 2–4 weeks. Optical and MEMS sensors (particulate matter, VOCs) drift more slowly but can't be field-calibrated—you'll need to validate against reference instruments.
- Power consumption: Critical for battery-powered deployments. A sensor drawing 50mA at 5V needs roughly 1.2Ah daily—a 10,000mAh USB power bank lasts about 8 days, less in cold weather when battery capacity drops.
- Data logging vs real-time: Does the kit include onboard storage (SD card slot), or must it stream continuously to a computer/cloud service? The former enables remote deployment; the latter requires constant connectivity.
The Seeed Studio Grove Beginner Kit for Arduino bundles ten sensors including light, sound, temperature, and air pressure in a single board with pre-wired connections—ideal for first projects where you're still learning which variables interest you. But understand its limitations: the sound sensor measures decibel levels but not frequency spectra, so you can track "how loud" but not "what kind of noise." That's fine for correlation studies (does traffic noise correlate with particulate spikes?) but inadequate for acoustic ecology research.
For students ready to contribute to actual citizen science research, look at kits explicitly designed for data compatibility with existing networks. The PurpleAir sensor (not a kit—it's a finished product around $280) uses the same Plantower PMS5003 particulate sensor that professional air quality networks deploy, meaning your data directly compares to EPA reference monitors. That's how you go from "science project" to "publishable observation."
Step 2: Assemble and Test Your Sensor Platform
Most environmental sensor kits ship as loose components requiring assembly—this isn't an oversight, it's intentional pedagogy. You need to understand the signal chain: sensor → analog-to-digital converter → microcontroller → data storage/transmission. When your pH readings start drifting two weeks into a deployment, you'll troubleshoot systematically only if you assembled the system yourself and know where each connection might fail.
Follow the manufacturer's wiring diagram exactly. Environmental sensors are less forgiving than LEDs and motors—reverse polarity on an electrochemical sensor destroys it permanently, and there's no visual "it's not working" feedback like a dark LED. You get garbage data that looks plausible until you realize your dissolved oxygen readings show 140% saturation (physically impossible—water maxes out around 100% DO at sea level and 20°C).
Power requirements matter more than you think. The BME680 sensor draws minimal current (3.7mA typical), but add a cellular modem for remote data transmission and you're pulling 200mA during transmission bursts. Size your power supply for peak load, not average. I learned this the hard way deploying a solar-powered air quality monitor in Seattle's winter—six hours of dim daylight couldn't keep up with hourly data uploads, and I lost a week of January readings before switching to daily batch uploads at noon.
Software setup:
- Install Arduino IDE or Python environment per manufacturer instructions
- Load the example sketch/script to verify sensor readings
- Critical step: Let sensors thermally stabilize for 30–60 minutes before checking readings. MOX gas sensors (like the BME680's VOC element) need a "burn-in" period where the heating element reaches operating temperature and resistance values settle.
For Arduino platforms, you'll typically install sensor-specific libraries via the Library Manager (Sketch → Include Library → Manage Libraries). The BME680 requires the "Adafruit BME680 Library" plus the "Adafruit Unified Sensor" dependency. Python users install packages via pip: pip install adafruit-circuitpython-bme680 for CircuitPython boards like the Adafruit Feather M4 Express.
Connectivity check: If your kit supports wireless data logging (WiFi, LoRa, cellular), test transmission indoors before field deployment. Signal strength drops faster than you expect—LoRa might promise 10km range in open terrain, but inside a dense forest or urban canyon, you're lucky to get 500 meters. Understanding what is citizen science for kids means accepting these real-world constraints that professional researchers navigate constantly.
Step 3: Calibrate Your Sensors Against Known Standards
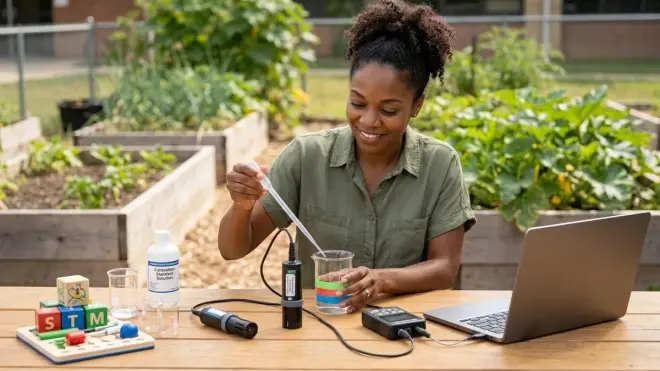
This is where most student projects fail. You wouldn't trust a thermometer that's never been compared to a reference temperature—yet kids deploy pH sensors straight from the box and assume the readings mean something. They don't. Sensors measure voltage, resistance, or capacitance; calibration is what transforms those electrical signals into meaningful environmental units.
For pH sensors:
- Use at minimum two-point calibration with pH 7.0 and pH 4.0 buffer solutions (buy from scientific supply companies, not aquarium stores—the latter aren't certified accurate)
- Rinse probe with distilled water between buffer solutions
- Let the reading stabilize (30–60 seconds) before recording calibration values
- Recalibrate every 2 weeks or after 100 measurements, whichever comes first
For particulate matter sensors:
- Factory calibration is usually adequate for educational projects
- Validation (not true calibration) requires comparing your sensor to a reference monitor—some U.S. cities have EPA AirNow sensors with publicly posted data you can benchmark against
- Deploy your sensor near the reference site, log simultaneously for 24 hours, then plot your readings against theirs to check correlation
For temperature/humidity:
- Digital sensors (DHT22, BME280) rarely drift significantly
- Validate against a calibrated thermometer (not a cheap household one—±2°C accuracy isn't good enough)
- For humidity, use salt-slurry method: saturated NaCl solution in a sealed container equilibrates to 75% RH at 20°C
Gas sensors (CO₂, VOCs, ozone):
- These are the trickiest—true calibration requires certified gas standards in pressurized cylinders (expensive and requires adult supervision)
- For student projects, validate against outdoor baseline: take your CO₂ sensor outside away from buildings/traffic, let it stabilize for 20 minutes, and it should read 420±20 ppm (current atmospheric CO₂ as of 2026)
- VOC sensors don't measure specific chemicals; they report a composite index. You can't calibrate them in absolute terms, but you can establish a baseline in clean air and track relative changes.
I've watched too many students spend weeks collecting data, only to discover during analysis that their sensor drifted out of calibration on day three and every subsequent reading is meaningless. Build recalibration into your project timeline—it's not optional. Professional environmental monitoring networks recalibrate quarterly or more frequently; your school project should too. For detailed procedures specific to different sensor types, see our Environmental Sensor Calibration Checklist for Student Scientists.
Step 4: Deploy Your Sensor and Establish Data Collection Protocol
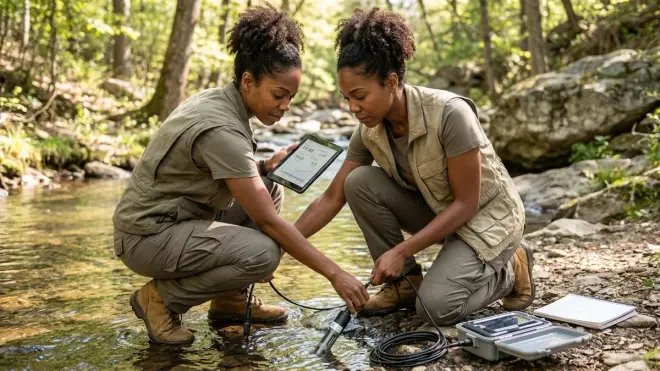
Site selection isn't arbitrary. If you're measuring air quality, sensor height matters—mount at breathing height (1.5m for adults, 1m for children) because particulate stratification means ground-level and rooftop readings differ substantially. For water quality, decide whether you're sampling surface water, mid-depth, or bottom—dissolved oxygen varies dramatically with depth in stratified lakes.
Weatherproofing for outdoor deployment:
- IP65-rated enclosures protect against rain and dust but not submersion
- Drill vent holes (with baffles to prevent direct water entry) for air sensors—a sealed box creates its own microclimate with artificially high humidity and CO₂ from sensor heating
- Use cable glands for wire penetrations; hot glue is not weatherproof regardless of what YouTube suggests
- Mount sensors vertically or angled to prevent water pooling on sensor faces
- UV degrades most 3D-printed enclosures within 6–12 months; paint with UV-resistant coating or use injection-molded project boxes
Data logging strategy:
- Sampling interval: More frequent isn't always better. Logging every second generates massive files and drains batteries but doesn't capture additional information if your phenomenon varies on hourly timescales. Match sampling rate to your research question—temperature might change meaningfully every 15 minutes, but soil moisture might only need hourly checks.
- Data storage: SD cards fail. Always log to redundant storage (local SD card + cloud upload) if your platform supports it. Format cards as FAT32 for maximum compatibility. Use industrial-grade SD cards rated for continuous write cycles, not cheap consumer cards that corrupt after a few thousand writes.
- Timestamp synchronization: Your microcontroller's clock drifts 1–2 minutes per month without RTC (real-time clock) modules. Add a DS3231 RTC module (~$8) with battery backup for accurate timestamping. This matters when you're correlating your data with external datasets like traffic patterns or weather records.
Legal and ethical considerations:
- Deploying sensors on public property often requires permits; check with your city's facilities department
- School property requires administrative approval
- Never trespass on private property for sensor deployment
- If monitoring neighbors' activities (even unintentionally—like noise or light pollution), notify them; environmental monitoring isn't espionage
Power management makes or breaks remote deployments. For solar-powered setups, size panels at 3× your average daily power consumption to handle cloudy days and winter sun angles. A project drawing 100mAh continuous (2.4Ah daily) needs at least a 7.2Ah daily solar budget, which requires about a 10W panel in temperate latitudes with MPPT charge controller efficiency losses. I've documented this repeatedly in my own solar monitoring stations—oversizing feels wasteful until November arrives and you're actually glad for that extra panel capacity.
Step 5: Collect Data While Monitoring Sensor Health
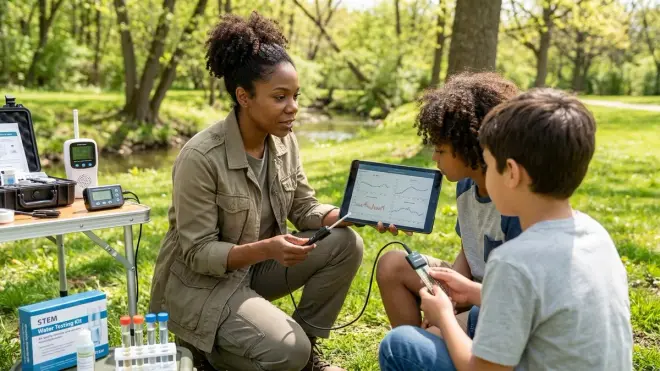
Data collection isn't passive—you don't just press "start" and return in a month. Sensor health monitoring distinguishes real projects from abandoned experiments rusting in the backyard.
Weekly site visits should check:
- Physical integrity (animals, weather damage, vandalism)
- Power supply voltage (if battery-powered, log voltage alongside environmental data so you can identify when low battery affects readings)
- Sensor cleanliness (dust on optical sensors, biofilm on pH probes, spider webs blocking airflow)
- Data file integrity (spot-check recent logs to ensure writes are completing successfully)
Red flags indicating sensor failure:
- Readings "stuck" at the same value for hours (often indicates electrical disconnection)
- Impossible values (150% humidity, -50°C in summer, negative particulate counts)
- Sudden shifts not correlated with weather or known events (usually calibration drift or electrical noise)
- Periodic spikes at exact intervals (often indicates power supply interference or electromagnetic noise from nearby equipment)
Dealing with data gaps:
- Don't delete outliers without justification—what looks like an error might be a real pollution event
- When you do exclude bad data, document why in your methodology notes
- Plan for 10–20% data loss in any outdoor deployment; sensors fail, power dies, cards corrupt
Backup and version control:
- Copy raw data files weekly to at least two locations (computer + cloud storage)
- Never edit raw data files directly; work on copies for analysis
- Use descriptive filenames with dates:
air_quality_raw_2026-03-15_to_2026-03-22.csv
This is also when you'll start noticing patterns that tempt you to end data collection early. Resist. You need enough data to distinguish signal from noise—absolute minimum is two weeks for diurnal patterns, four weeks for weekly cycles, and ideally three months to start seeing seasonal trends. I've seen compelling month-long datasets become publishable three-month studies just by maintaining discipline and keeping sensors running through the "boring" periods where nothing seems to change. Those stable baselines are what make the pollution spikes statistically significant.
For students working toward Starting Your First Citizen Science Project: Complete Setup Checklist, rigorous data quality documentation is what separates "I logged some numbers" from "I generated research-grade observations."
Step 6: Import and Clean Your Data
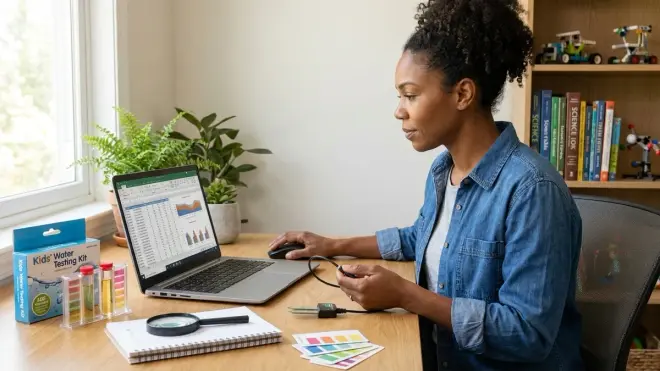
Raw sensor data is messy. You'll have outliers, missing values, duplicated timestamps, and formatting inconsistencies. Data cleaning isn't cheating—it's essential methodology that you must document transparently.
For Arduino-logged CSV files:
- Import into Google Sheets (beginner-friendly) or Python pandas (industry standard)
- Check for duplicate timestamps (often caused by RTC reset events)
- Identify and flag impossible values (negative PM2.5 readings, humidity >100%, temperatures outside sensor range)
- Critical decision: Delete obvious errors (sensor clearly disconnected showing 0.00 for all fields), but flag suspicious values rather than deleting (sudden spike might be real pollution event)
Python workflow (intermediate level):
import pandas as pd
import matplotlib.pyplot as plt

# Load data
df = pd.read_csv('sensor_data.csv', parse_dates=['timestamp'])

# Basic cleaning
df = df.dropna(subset=['temperature'])  # Remove rows missing temp
df = df[df['humidity'] <= 100]  # Remove impossible humidity
df = df.sort_values('timestamp')  # Ensure chronological order

# Flag outliers without deleting
df['temp_outlier'] = (df['temperature'] > df['temperature'].mean() + 3*df['temperature'].std())
For block-based platforms (Scratch-style interfaces on some educational sensor kits), export to CSV then follow the same process. You'll likely need to manually clean data since these platforms lack filtering functions.
Statistical outlier detection:
- Z-score method: flag values >3 standard deviations from mean (assumes normal distribution)
- IQR method: flag values >1.5× interquartile range beyond Q1/Q3 (works with skewed distributions)
- But always plot the data first—statistical tests can't distinguish sensor malfunction from genuine extreme events
Time zone and timestamp issues:
- Ensure all timestamps use consistent time zone (UTC is standard for scientific data)
- Check for daylight saving time transitions if logging across spring/fall DST changes
- Verify sampling intervals are consistent (gaps indicate power failures or SD card write errors)
Metadata documentation (critical for reproducibility): Create a separate file documenting sensor make/model, calibration dates, deployment location coordinates, height above ground, environmental conditions (e.g., "sensor shaded by trees 2–5pm"), known interference sources, and any changes during deployment (battery replacement, recalibration, physical relocation).
You'll find that data cleaning takes longer than collection—that's normal. Professional researchers spend 60–80% of project time on data wrangling and only 20–40% on analysis. Students learning how to collect environmental data kids can validate and publish need to internalize this reality: the quality of your conclusions depends entirely on the rigor of this unglamorous cleaning phase.
Step 7: Visualize and Analyze Your Environmental Data
Visualization comes before statistical analysis—always. Plotting your data reveals patterns, anomalies, and relationships that summary statistics hide. A correlation coefficient of r=0.85 sounds impressive until you plot the data and realize it's driven entirely by three outlier points.
Essential plots for time-series environmental data:
1. Time-series line plots showing how each variable changes over your collection period. Plot temperature, humidity, and pressure on separate subplots sharing the same x-axis (time) so you can visually correlate patterns. Did particulate matter spike every weekday at 8am? That's rush-hour traffic. Did dissolved oxygen drop overnight? That's aquatic plant respiration without photosynthetic oxygen production.
2. Diurnal average plots that overlay all your daily cycles, showing typical patterns. Average all your Monday 3pm temperature readings together, all Monday 4pm readings together, etc., to build a 24-hour average profile. This reveals daily patterns obscured by day-to-day weather variation.
3. Correlation scatter plots between pairs of variables. Plot temperature vs humidity, particulate matter vs wind speed, pH vs rainfall. You're looking for relationships—are variables correlated? Inversely correlated? Completely independent?
Tools by skill level:
Beginner: Google Sheets built-in charts
- Insert → Chart, choose line graph for time series
- Limited customization but requires zero coding
- Export as images for reports/presentations
Intermediate: Plotly (Python library) or Grafana (web-based dashboard)
- Plotly generates interactive plots you can zoom/pan in browser
- Grafana connects directly to many sensor platforms for real-time monitoring
- Requires basic programming comfort but produces publication-quality visualizations
Advanced: Jupyter Notebooks with matplotlib/seaborn (Python)
- Industry standard for scientific data analysis
- Full statistical toolkit available (regression, hypothesis testing, spectral analysis)
- Steep learning curve but this is what working data scientists actually use
Statistical analysis appropriate for student projects:
- Descriptive statistics: mean, median, standard deviation, min/max for each variable
- Correlation analysis: calculate Pearson correlation coefficients between variable pairs
- Hypothesis testing: t-tests to compare weekend vs weekday pollution levels, or before/after intervention comparisons
- Linear regression: model relationships like "temperature predicts humidity with equation y = mx + b"
What statistical significance actually means: A p-value <0.05 doesn't prove your hypothesis is correct—it means there's <5% probability you'd see this pattern if the null hypothesis (no relationship) were true. With enough data points, even tiny meaningless correlations become "statistically significant." Plot everything and ask whether the relationship makes physical sense.
Common analysis mistakes:
- Confusing correlation with causation (ice cream sales correlate with shark attacks, but ice cream doesn't cause shark attacks—both correlate with summer beach season)
- Cherry-picking time windows that support your hypothesis while ignoring contradictory periods
- Ignoring confounding variables (your PM2.5 sensor shows spikes every Saturday, but you deployed it near a farmer's market that operates Saturdays—the spike might be from vehicle exhaust, not ambient air quality)
You're building the same analytical skills that researchers use in Renewable Energy Science Projects: Complete Guide to Solar, Wind & Sustainable Power Learning Kits when optimizing panel angles based on insolation data, or in professional climate science when correlating atmospheric CO₂ with temperature records. The difference between student project and publishable research is often just sample size and measurement precision—the methodology is identical.
Step 8: Present Your Findings and Contribute to Open Data
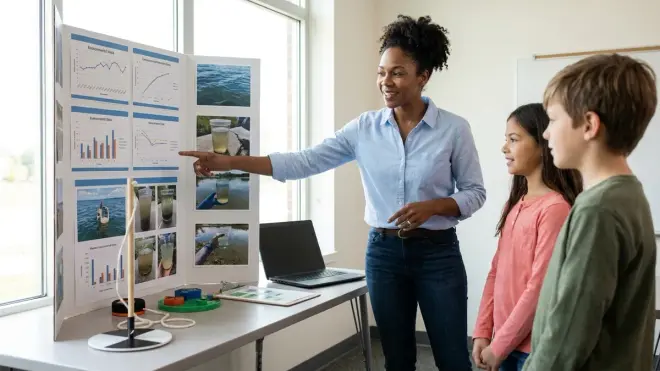
Science isn't complete until it's communicated. Your analysis means nothing sitting on your laptop—the final step is sharing results in formats other people can understand and use.
For school science fair presentations:
- Lead with your research question, not your methodology
- Show visualizations, not tables of numbers (tables go in appendices)
- Discuss limitations honestly—sensor accuracy, calibration drift, short collection period
- Suggest follow-up questions your data raises
For contributing to citizen science networks: Many platforms accept student-collected data if it meets quality standards:
- SciStarter aggregates hundreds of citizen science projects seeking observations
- PurpleAir map displays air quality data from thousands of contributor sensors worldwide
- iNaturalist for biodiversity observations (if you photographed organisms during site visits)
- Local watershed groups often maintain water quality databases accepting volunteer data
Data quality requirements for contribution:
- Documented calibration procedures and dates
- Sensor make/model and accuracy specifications
- Precise GPS coordinates and deployment height
- Timestamp accuracy (typically ±5 minutes required)
- Metadata explaining collection methodology
Open data licensing: When you publish data publicly, include a license specifying reuse terms. Creative Commons CC-BY (attribution required) is standard for scientific data. This lets other researchers use your observations in meta-analyses and regional studies while ensuring you get credit.
GitHub or similar repository: For students comfortable with version control, publishing raw data and analysis code on GitHub demonstrates professional-level workflow. Include:
- Raw data files (CSV format, industry standard)
- Cleaning/analysis scripts with comments explaining each step
- README file documenting sensors, calibration, deployment conditions
- Visualizations as PNG/PDF
This portfolio becomes evidence of real data science skills when applying to university STEM programs or internships. Admission committees see thousands of robotics projects; they rarely see rigorous environmental monitoring with published datasets.
Long-term monitoring: The most valuable citizen science contributions come from sustained monitoring. A single month of air quality data is interesting; three years of continuous data becomes scientifically significant for tracking trends. If your project reveals something compelling, consider maintaining the deployment long-term. Automate data uploads, set calendar reminders for quarterly calibration, and treat it like the serious research it is.
Professional environmental monitoring careers—air quality engineering, watershed management, climate research—all rely on exactly this workflow you've now mastered: sensor deployment, calibration, data cleaning, statistical analysis, and transparent communication. For students considering best citizen science kits for kids as a pathway to real research contributions, completing this full cycle once transforms you from "interested student" to "practicing environmental data scientist."
Pro Tips & Common Mistakes
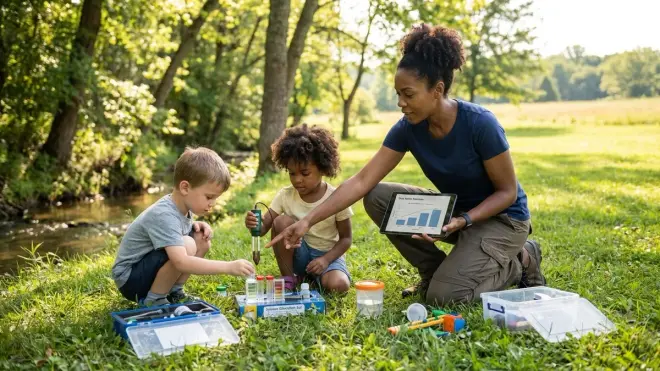
Pro tip: Log metadata alongside environmental data. Include columns for battery voltage, sensor temperature (different from ambient temperature), WiFi signal strength if applicable, and SD card free space. When your humidity readings start drifting, you can correlate that with dropping battery voltage and identify power supply issues before they invalidate weeks of data. I've saved countless deployments by catching low-battery warnings in metadata that weren't yet severe enough to affect primary readings.
Pro tip: Build redundancy for critical sensors. If particulate matter is your primary research target, deploy two PM2.5 sensors side-by-side and log both independently. When readings diverge, you know one has failed and can compare against the other to identify which. Professional monitoring stations run 2–3 parallel instruments for exactly this reason.
Common mistake: Deploying sensors in unrepresentative microenvironments. Mounting your temperature sensor on a sun-facing wall creates an artificial heat island. Placing your air quality monitor downwind of a BBQ grill measures grill exhaust, not ambient air. Think carefully about sensor placement—is it measuring what you think it's measuring?
Common mistake: Ignoring sensor warm-up time. Most environmental sensors need 30–60 seconds to stabilize after power-on. If you're logging battery-powered with sleep/wake cycles to conserve power, you must include warm-up delay before recording. Otherwise you're logging nonsense transient values as each sensor heats up.
Common mistake: Over-interpreting short-term correlations. You deployed your sensor for three days and noticed particulate matter correlates perfectly with rainfall. That might be real (rain scrubs particles from air), or it might be coincidence (three data points isn't enough to establish causation). Extend your study or explicitly acknowledge the limitation.
Pro tip: Join online communities before you need help. The Adafruit forums, Arduino Stack Exchange, and Reddit's r/CitizenScience are full of people who've debugged the exact sensor issue you're about to encounter. Search before asking, but don't hesitate to ask—environmental monitoring attracts unusually helpful communities because everyone's chasing the same goal of better planetary data.
Pro tip: Document everything in real-time. Keep a lab notebook (paper or digital) with dated entries for every deployment, calibration, observation, and hypothesis. When you're writing your methodology section two months later, you won't remember whether you calibrated on March 3rd or March 13th. Contemporary documentation is the only reliable record.
Frequently Asked Questions
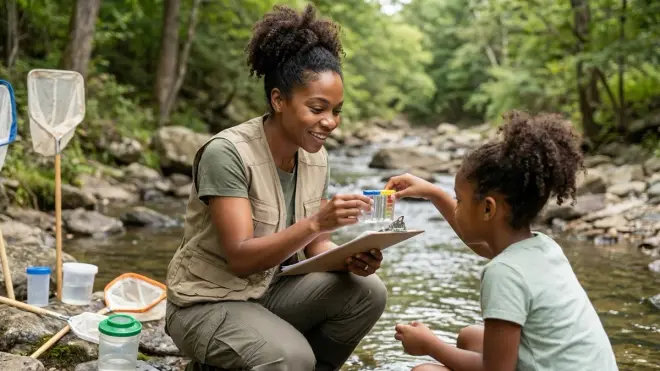
What's the minimum age for teaching kids how to collect environmental data with sensor kits safely and effectively?
Age 10–11 marks the minimum for independent data collection work, provided kids can follow written protocols precisely, tolerate delayed gratification (weeks between deployment and analysis), and handle the frustration when sensors fail or data gets corrupted—which happens constantly in environmental fieldwork. Younger students (ages 7–9) can participate in structured data collection where an adult handles calibration and troubleshooting, focusing the child's involvement on observation logging and pattern recognition in cleaned datasets. The critical skill isn't technical knowledge but methodological discipline—the ability to follow the same procedure identically every time, because inconsistent methodology produces meaningless data regardless of sensor quality.
How long should kids collect environmental data before they have enough for meaningful analysis and conclusions?
Minimum two weeks for diurnal pattern analysis, four weeks to capture weekly cycles (weekday vs weekend pollution patterns), and ideally 8–12 weeks to establish baseline variability and identify genuine anomalies versus normal fluctuation—that's the honest answer researchers don't often share with students launching first projects. For climate-relevant measurements like temperature trends, you need minimum six months spanning seasonal transitions, and preferably 2–3 years to separate annual weather variation from longer-term trends. Start with realistic scope (two-week intensive study of rush-hour air quality) rather than abandoning an overly ambitious year-long project after six weeks; you can always extend collection if initial results prove compelling, but there's no salvaging an incomplete dataset from a project you quit.
Can kids use Arduino or Raspberry Pi platforms for environmental monitoring, or do they need pre-built sensor kits?
Arduino and Raspberry Pi platforms offer dramatically more flexibility and lower cost than pre-built educational sensor packages, but require comfort with breadboarding, library installation, and code troubleshooting—skills typically mastered around ages 12–14 for Arduino, 14–16 for Raspberry Pi Python workflows. Pre-built kits like the Grove Beginner Kit eliminate connection errors and come with validated example code, making them ideal for first environmental monitoring projects where you're learning data collection methodology and don't want electrical debugging to derail the science. The progression path I recommend: start with pre-wired kit (ages 10–12), transition to Arduino with modular sensors like Grove or Qwiic connectors that reduce wiring complexity (ages 12–14), then advance to fully custom Arduino builds with raw sensors requiring breadboard circuits (ages 14+), and finally Raspberry Pi with Python for students ready for professional-grade data pipelines and machine learning integration (ages 15–16+). For detailed platform comparisons, see Arduino vs micro:bit for Citizen Science: Which Platform Is Better?.
What environmental sensors provide data accurate enough for real citizen science contributions rather than just educational demonstrations?
Plantower PMS5003 particulate matter sensors (used in PurpleAir monitors and many DIY kits) produce research-grade PM2.5 and PM10 data when properly calibrated, with accuracy within 10–15% of EPA reference monitors—that's acceptable for citizen science networks and some regulatory applications. Atlas Scientific pH, conductivity, and dissolved oxygen sensors meet scientific-grade accuracy specs (±0.02 pH, ±2% conductivity) but require rigorous calibration every 2–4 weeks and cost $150–$200 per probe compared to $15 hobby-grade sensors that drift 0.5+ pH units over weeks. BME280/BME680 temperature and humidity sensors are excellent for meteorological data (±0.5°C, ±3% RH) and widely used in weather station networks. Avoid: cheap MQ-series gas sensors (MQ-7 CO, MQ-135 air quality) marketed for Arduino—these lack calibration standards, exhibit severe cross-sensitivity (respond to wrong gases), and drift so badly they're unsuitable even for relative trending; if you need gas sensing, invest in electrochemical sensors (Alphasense or Spec Sensors brands) that cost $50–$80 but produce defensible data. The honest reality: sensors accurate enough for publishable citizen science cost $200–$500 total for a complete monitoring station; $50 educational kits teach methodology but produce data too noisy for scientific contribution beyond "yes, pollution exists."
Summary
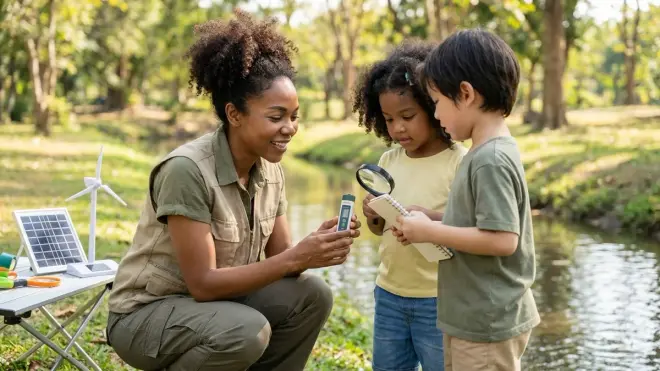
You've now walked through the complete workflow professional environmental scientists use daily: formulating research questions that drive sensor selection, establishing rigorous calibration protocols, deploying instruments with attention to microenvironment effects and power budgets, maintaining data quality through systematic sensor health monitoring, cleaning datasets with documented methodology, visualizing patterns before statistical analysis, and finally communicating findings through appropriate channels. Learning how to collect environmental data kids can independently validate and contribute to open science databases transforms passive STEM consumption into active scientific participation—you're no longer studying about climate change or pollution, you're generating primary observations that quantify these phenomena in your own community.
The sensor kits and platforms we've discussed range from $40 pre-wired Grove systems for learning methodology to $250 Arduino-based research-grade deployments contributing to EPA air quality maps, but the underlying skills remain constant: calibration discipline, metadata documentation, statistical literacy, and honest acknowledgment of limitations. These capabilities transfer directly to professional environmental monitoring careers, university research labs, and the growing field of civic technology where citizens deploy sensor networks to hold polluters accountable. For students ready to build on this foundation with renewable energy integration, explore best environmental monitoring kits for citizen science projects to see how solar-powered remote sensors enable months-long autonomous deployments—because the most valuable environmental datasets come from sustained observation, not one-week school projects.
The future needs environmental data scientists who understand not just coding and sensors, but the messy reality of fieldwork: sensors that fail during critical pollution events, calibration drift that invalidates weeks of data, and the humbling recognition that nature generates far more complexity than our instruments can capture. Start collecting. Start learning. Start contributing.