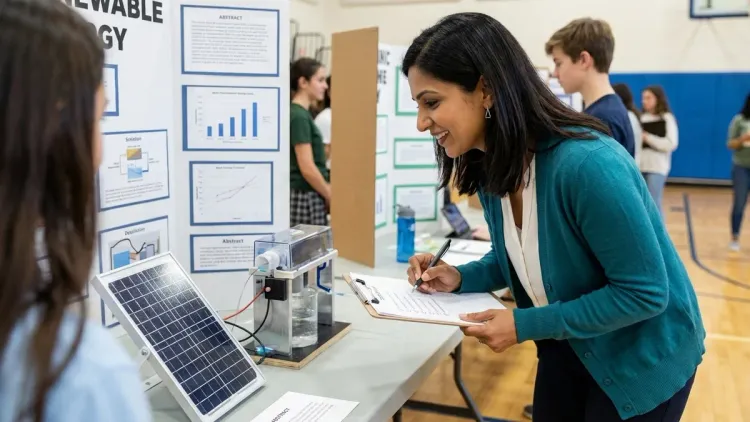
You're looking at a renewable energy science fair project, and it feels like you're assembling a puzzle where the pieces haven't arrived yet. I've watched hundreds of students—and their parents—approach these projects with enthusiasm, only to hit preventable roadblocks three days before the fair. This renewable energy science fair projects checklist walks you through every phase from initial concept to final presentation, organized by the actual workflow stages that determine success. Whether your student is building their first solar panel display or designing a wind turbine efficiency study, this framework helps you plan lab equipment needs, data collection protocols, and presentation materials with the same systematic approach my middle-schoolers use in our district science fairs.
This checklist scaffolds the entire project timeline, not just the day-of logistics. You'll find specific planning items for concept selection, concrete lab specifications for equipment setup, and presentation deliverables that meet judging rubrics.

Project Planning and Concept Selection
Define your specific renewable energy focus and measurable outcome. The phrase "renewable energy" covers solar, wind, hydro, geothermal, and biomass—you can't investigate all of them meaningfully in one project. Choose one energy type and one measurable question: "Which blade angle produces maximum voltage in a wind turbine?" beats "How does wind energy work?" every time. This specificity determines every supply you'll purchase and every data point you'll collect.
Research industry-standard measurement protocols for your chosen energy type. If you're measuring solar panel efficiency, you need to understand how professionals calculate it (power output divided by solar irradiance multiplied by panel area), not just shine a flashlight and call it data. For wind projects, you'll need consistent anemometer readings and controlled blade designs. The how to measure solar panel efficiency in science projects resource explains these protocols in student-accessible terms—I reference it constantly when students choose photovoltaic projects because it prevents the "I tested it and it worked" trap.
Identify the skill milestones this project will demonstrate. Science fair judges assess process skills, not just pretty displays. A strong renewable energy project shows hypothesis formation, variable control, systematic data collection, quantitative analysis, and iterative design thinking. List which NGSS standards your project addresses (typically MS-PS3 Energy, MS-ESS3 Earth and Human Activity, or HS-ETS1 Engineering Design for older students) so you can frame your presentation around demonstrable competencies, not just showing off a working model.
Map your project timeline backward from the fair date. Most renewable energy projects need 4-6 weeks minimum: one week for research and design, two weeks for building and initial testing (with time for component failures—they happen), one week for systematic data collection under controlled conditions, and one week for analysis and presentation assembly. Block out non-negotiable school commitments, family trips, and equipment delivery windows now. I've seen brilliant projects collapse because students assumed their Thames & Kosmos Wind Power 2.0 Kit would arrive overnight and didn't account for the learning curve on assembly.
Audit your home lab specifications against project requirements. Renewable energy experiments demand specific infrastructure. Solar projects need consistent light sources (natural sunlight introduces too many variables—you need artificial lighting with known lumen output), stable mounting surfaces, and multimeters capable of measuring DC voltage and current simultaneously. Wind projects require open testing space away from wall interference and reliable power measurement tools. The everything you need for a renewable energy science experiment article breaks down these lab specs by project type, including power requirements and expandability for multiple trials.
Check compatibility between your concept and available educational kits versus custom builds. Pre-engineered kits like the Thames & Kosmos Alternative Energy and Environmental Science Kit provide consistent variables and documented specifications—critical when judges question your methodology. Custom builds from scratch demonstrate higher engineering skills but require precise documentation of every component spec. For first-time renewable energy projects, I recommend hybrid approaches: use a kit for the core energy generation component, then design your own testing apparatus around it. This balances reliability with authentic problem-solving.
Determine whether your project requires consumables or subscription services. Most renewable energy projects avoid consumables (a huge advantage over chemistry experiments), but some require replacement parts. Wind turbine blade materials may need multiple iterations if you're testing design variables. Data logging software might need licenses—Arduino IDE and Python are free, but some graphical analysis tools aren't. The solar vs wind energy projects comparison explores these ongoing cost factors across project types, which matters when you're budgeting lab investments that extend beyond this single fair.
Establish clear success criteria that aren't binary "it works/doesn't work" outcomes. A solar panel that lights an LED doesn't demonstrate scientific inquiry—measuring how panel angle affects voltage output across 15-degree increments does. Define your dependent variable (voltage, current, power output, efficiency percentage), your independent variable (blade count, panel angle, distance from light source), and your controlled variables (light intensity, measurement duration, ambient temperature). This clarity prevents scope creep and keeps your data collection focused.
Equipment Assembly and Lab Setup
Verify technical compatibility across all energy generation, measurement, and data logging components. Voltage outputs from small solar panels or turbines rarely exceed 5V DC, so your multimeter needs millivolt precision. If you're using Arduino-based data logging (recommended for continuous measurement), confirm your sensors operate within Arduino's 0-5V input range. The Elenco Snap Circuits Green Alternative Energy Kit uses standardized components that interconnect reliably, but mixing brands often introduces connection problems. I've watched students lose days troubleshooting mismatched connector types—check pin configurations and voltage compatibility before final purchase.
Set up dedicated testing space with controlled environmental variables. Renewable energy outputs fluctuate wildly with environmental changes, which ruins data validity. Your solar testing area needs consistent artificial lighting (LED grow lights at fixed distance work well—document lumens and spectrum), black backdrop to prevent reflection interference, and temperature monitoring (solar cell efficiency decreases as temperature rises, typically 0.5% per degree Celsius above 25°C). Wind testing requires minimum 3-foot clearance on all sides to prevent wall effects that alter airflow, plus a consistent fan or blower rated for measurable wind speeds.
Install proper power management and safety infrastructure. Even low-voltage renewable energy projects need correct electrical safety practices. Use banana plug test leads rated for DC circuits, not random wire scraps. Mount your multimeter securely so readings don't shift mid-measurement. If your project includes battery charging circuits (common in solar projects demonstrating energy storage), verify the battery type matches your charging circuit—LiPo batteries require different management than NiMH. The home STEM lab safety checklist covers electrical safety protocols that matter even at low voltages, including proper grounding and circuit protection.
Build modular testing apparatus that supports multiple trials without teardown. Science fair projects need repeated measurements to demonstrate reliability—your setup should allow you to run ten trials in a row without disassembling anything. For solar projects, mount your panel on a protractor base that lets you adjust angle precisely and repeatably. For wind projects, create a blade-swapping mechanism that maintains consistent hub geometry. I always tell students: if you can't replicate your exact setup after lunch, your data will have uncontrolled variables, and judges will notice.
Document baseline performance before modifying any variables. Run your complete experimental setup in its "control" configuration for five trials minimum. Record every measurement: voltage, current, wind speed, light intensity, ambient temperature, humidity. These baseline readings prove your equipment works consistently and give you reference points when results look odd later. Calculate standard deviation—if your five baseline trials vary by more than 10%, you have an equipment stability problem to fix before collecting experimental data.
Prepare data logging infrastructure with redundancy. Hand-written lab notebooks are mandatory (judges want to see your raw data and observation notes), but digital logging prevents transcription errors and enables graphing. If you're using Arduino for automated logging, write your data to both Serial Monitor (for real-time verification) and SD card (for backup). Python scripts should save to timestamped CSV files. Test your logging system during baseline trials—I've seen students lose entire datasets because their SD card wasn't formatted correctly or their Python script overwrote the same file repeatedly.
Create photography and documentation stations near your testing area. You'll need process photos for your display board—set up smartphone mounts or tablet stands at angles that capture your experimental setup clearly. Document each configuration before you run trials. If you're testing multiple blade designs for a wind turbine, photograph each blade set with a ruler for scale reference. These images become crucial when writing your methodology section and answering judges' setup questions.
Establish measurement protocols that eliminate human variability. Decide now: Are you measuring voltage after 30 seconds of generation? Maximum voltage during a 60-second window? Average voltage over five minutes? Write your protocol down and follow it identically for every trial. Use timers and consistent measurement procedures. For projects comparing performance across variables (three different blade counts, five different panel angles), run all configurations in randomized order to prevent time-of-day effects from skewing results.
Data Collection and Analysis
Execute your full experimental matrix with consistent measurement intervals. If you're testing five different solar panel angles, run five trials at each angle—that's 25 total data collection sessions. Space them across multiple days to prove reproducibility (day-to-day consistency strengthens your conclusions). Record ambient conditions for every trial: room temperature, light source warm-up time (LED output stabilizes after ~5 minutes), time of day if using natural light (not recommended, but if unavoidable, note sun angle). This thoroughness separates science fair projects from demonstrations.
Use industry-standard formulas for calculating renewable energy metrics. For solar efficiency, the formula is: (Power Output / (Solar Irradiance × Panel Area)) × 100. Power output is voltage multiplied by current. Solar irradiance needs measurement with a light meter (or specification from your artificial light source). Panel area requires precise measurement in square meters. For wind turbine power, use: 0.5 × Air Density × Swept Area × Wind Speed³ × Efficiency Coefficient. These calculations transform raw voltage readings into comparable efficiency percentages that judges understand and respect.
Graph your data with proper axis labels, units, and error bars. Science fair display boards need visual data representation—Excel, Google Sheets, or Python matplotlib all work. Your independent variable (what you changed) goes on the x-axis; your dependent variable (what you measured) goes on the y-axis. Include error bars showing standard deviation or range across your multiple trials. Title your graphs descriptively: "Solar Panel Voltage Output vs. Panel Angle (15° increments)" tells judges exactly what they're viewing. I've watched projects with solid data lose points because unlabeled graphs left judges confused about what was measured.
Analyze trends and identify optimal configurations with supporting calculations. Your data should reveal patterns: Does voltage output increase linearly with blade count or plateau after four blades? Does solar panel efficiency peak at 45 degrees or vary with season-specific sun angles? Calculate percentage differences between your best and worst configurations. If your optimized wind turbine produces 30% more voltage than your baseline design, that's a quantifiable engineering improvement worth highlighting in your abstract and conclusion.
Prepare explanatory captions that connect data to renewable energy principles. Raw graphs don't explain themselves. Write 2-3 sentence captions for each graph explaining the physics behind the pattern. "Voltage output peaked at 45° panel angle because this orientation maximized surface area perpendicular to the light source, increasing photon absorption according to the cosine projection rule" demonstrates conceptual understanding beyond just collecting numbers. Reference the what is renewable energy for kids guide if you need accessible explanations of photovoltaic effects, electromagnetic induction, or aerodynamic lift that you can adapt to your caption language.
Identify limitations and sources of experimental error honestly. No science fair project executes perfectly—acknowledging limitations shows scientific maturity. Did your wind turbine wobble slightly on its axis, introducing friction inconsistencies? Did your light source heat up the solar panel, conflating thermal effects with angle effects? List these factors in your lab notebook and conclusion. Judges appreciate students who recognize where their methodology could improve rather than claiming flawless results.
Compare your results to professional renewable energy benchmarks. How does your optimized solar panel efficiency (probably 5-15% for small educational panels) compare to commercial solar panels (18-22% for monocrystalline silicon)? How does your wind turbine's performance relate to the Betz limit, the theoretical maximum of 59.3% efficiency for wind energy extraction? Contextualizing your results within real-world renewable energy engineering demonstrates that your project connects to actual industry challenges, not just classroom exercises.
Presentation Materials and Display Board Assembly
Design your display board with clear visual hierarchy following judging rubrics. Standard tri-fold boards use left panel for hypothesis and background research, center panel for eye-catching title and project photo, right panel for conclusion and applications. Your procedure section (usually lower left) needs numbered steps and labeled diagrams—judges should be able to replicate your experiment from this description alone. Use 18-24 point font minimum for body text, larger for section headers. Color-code sections consistently (I recommend blue for background/hypothesis, green for procedure, red for results, orange for conclusion).
Include high-resolution process photos showing experimental setup and testing phases. Judges need visual proof you executed the project yourself. Photograph your workspace during assembly, your measurement setup from multiple angles, and yourself actively collecting data (timed photos work for solo students). Print photos at 4×6 minimum size and mount them with captions explaining what each shows. For renewable energy projects, definitely include: your complete testing apparatus, close-up of measurement tools in use, and comparison images of different configurations you tested.
Create a concise abstract that summarizes question, methodology, results, and conclusion. Your abstract (typically 250 words maximum) lives at the center of your board and gets read first. Structure it: "This project investigated [specific question about renewable energy]. Using [equipment and methodology in one sentence], I tested [number of configurations] across [number of trials]. Results showed [key finding with specific data]. This demonstrates [broader principle or application to real renewable energy challenges]." I drill this structure with my students because it forces them to distill their project to its essential scientific contribution.
Prepare supplementary materials in a portfolio binder for judges. Your display board shows highlights; your portfolio contains complete documentation: full lab notebook with dated entries, raw data tables, calculation worksheets showing your efficiency formulas, bibliography of research sources (minimum 5 credible sources—Wikipedia is acceptable as starting point, but include industry publications or .edu sources like National Renewable Energy Laboratory resources), and safety protocols you followed. Organize with tabbed dividers. Judges flip through these while interviewing you, and thorough portfolios signal serious scientific work.
Build or bring your functional renewable energy demonstration model to the fair. Static display boards are fine, but projects that demonstrate working energy generation win disproportionately. Your solar panel setup should operate live at the fair—mount it on your table with a voltmeter showing real-time output. Wind turbine projects should include a portable fan and your turbine apparatus generating measurable power. Test your demonstration the night before to catch dead batteries, loose connections, or components damaged during transport. I've seen outstanding projects lose impact because their demonstration failed under fair lighting or table space constraints.
Script and rehearse your verbal presentation for judge interviews. Most science fairs give each student 5-10 minutes with judges for Q&A. Practice explaining: (1) Why you chose this renewable energy topic (personal interest + scientific relevance), (2) Your hypothesis and reasoning, (3) Your procedure in clear steps, (4) Key results with specific numbers, (5) What your findings mean for renewable energy development. Anticipate common judge questions: "How did you control for X variable?" "What would you change if you repeated this?" "How does your project relate to real solar/wind installations?" Role-play these conversations—confident, specific answers distinguish top projects from middle-tier ones.
Prepare a one-page project summary handout for judges and visitors. Some fairs allow students to provide take-away materials. A simple 8.5×11 handout with your name, project title, key graph, and conclusion gives judges quick reference during deliberations and shows professionalism. Format it cleanly, include one compelling photo of your setup, and summarize your quantitative finding in one bold sentence: "Three-blade turbine design generated 47% more power than two-blade configuration across 25 trials."
Final Check Before You Go
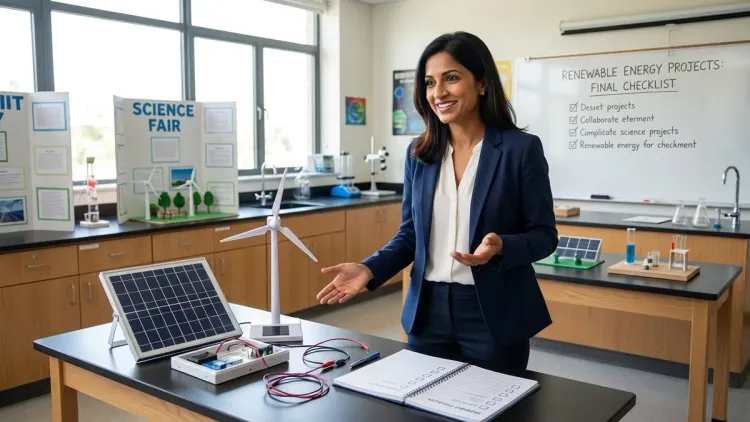
Run through this compressed renewable energy science fair projects checklist 48 hours before your fair date:
- Display board: All sections complete, photos mounted securely, text readable from 3 feet away, no spelling errors, title includes key terms (renewable energy, solar/wind, efficiency or power or your measured variable)
- Portfolio binder: Lab notebook, complete data tables, calculation worksheets, bibliography, safety documentation, tabbed and organized
- Working model: Functions reliably, all components secure, measurement tools calibrated and displaying correct units, backup batteries or power supply
- Verbal presentation: Practiced explanation under 3 minutes, anticipated judge questions answered confidently with specific data references
- Transportation: Protective covering for display board (garbage bags work), padded container for demonstration model, checklist of all components that must travel with you
- Contingency kit: Spare batteries, tape, glue stick, printed backup photos, extra mounting supplies, USB cable for data access if needed
This checklist prevents last-minute scrambles. I watch students at district fairs every year discover dead batteries or missing portfolio sections minutes before judging—preventable failures that don't reflect the quality of their scientific work.
Frequently Asked Questions
How long does a renewable energy science fair project take from start to finish?
A competitive renewable energy science fair project requires 4-6 weeks minimum for thorough execution: one week for research and experimental design, two weeks for equipment assembly and troubleshooting (account for component failures or unexpected variables), one week for systematic data collection across all your test conditions with multiple trials, and one week for data analysis, display board creation, and presentation practice. Students attempting these projects in under three weeks typically sacrifice either data quality (insufficient trials, uncontrolled variables) or presentation polish (rushed graphs, incomplete documentation), both of which judges notice immediately during evaluation. The equipment learning curve alone—understanding how to measure millivolt outputs, calibrate light sources, or maintain consistent wind speeds—takes longer than most families anticipate, especially for first-time renewable energy experimenters.
What's the most common mistake students make with renewable energy science fair projects?
The most common mistake is treating the project as a demonstration rather than a controlled experiment—building a solar panel or wind turbine that "works" without systematically testing variables or collecting quantitative data. I've seen countless projects where students assemble a kit, show that it generates electricity, then create a display board explaining how solar/wind power works theoretically, but they never investigated a specific, measurable question with multiple trials and data analysis. Science fair judges assess the scientific method execution: hypothesis formation, variable isolation, repeated measurements, statistical analysis, and evidence-based conclusions. A project that tests how blade angle affects wind turbine voltage output across 10-degree increments with five trials each demonstrates inquiry skills; a project that builds a turbine and explains renewable energy concepts does not, regardless of how impressive the final model looks.
Do I need expensive equipment to do a competitive renewable energy science fair project?
You don't need expensive equipment, but you absolutely need precise measurement tools and consistent testing conditions—a basic digital multimeter capable of measuring DC voltage and current ($15-25 range), a reliable light source with documented output for solar projects (LED shop light works fine if you record its specifications), and controlled testing space matter far more than premium energy generation components. The Elenco Snap Circuits Green Alternative Energy Kit provides reliable, well-documented components for around $60, which is sufficient for most middle school projects when paired with systematic testing protocols and thorough data collection. Advanced projects benefit from Arduino-based data logging ($25 for starter kit) and calibrated sensors, but judges primarily assess your methodology and analysis, not your equipment budget. I've seen award-winning projects built with $75 in total materials because the student executed rigorous experimental design, collected abundant data, and demonstrated clear understanding of underlying renewable energy principles—and I've seen expensive custom installations fail in judging because the student couldn't explain their variables or justify their conclusion with quantitative evidence.
Final Thoughts
This renewable energy science fair projects checklist gives you the systematic framework that separates successful projects from well-intentioned false starts. The students who place at district and state competitions aren't necessarily the ones with the most elaborate displays or expensive equipment—they're the ones who approached their project as authentic scientific inquiry rather than show-and-tell. They defined measurable questions, controlled their variables, collected abundant data, analyzed it with industry-standard calculations, and communicated their findings clearly.
The renewable energy focus carries particular weight because it connects student work to critical real-world challenges. Your project isn't just a classroom exercise—it's exploring the same efficiency questions, design trade-offs, and measurement challenges that professional engineers face when optimizing solar installations or wind farms. When you present your optimized turbine blade configuration or your analysis of solar panel angle efficiency, you're demonstrating the same problem-solving approach that drives renewable energy innovation in actual industry contexts.
Start with your question, map your timeline, gather your equipment thoughtfully, execute your trials systematically, and document everything thoroughly. The checklist works when you work it.